


Advanced Search Objects: results
Refine Results
/
1
1 to 5 of 5 for
- Thesaurus: Diagramm

Plakat
Travel is as safe as possible on the Underground
anonym
1928

Plakat
Underground Reliability - The Underground record
anonym
1929
Plakat
Olympische Spiele München 1972
Shusaku Arakawa
1970
![FD-2 - Flocking Diplomats New York - Individual Frequenzy Traces 1999 - The Diagram Shows the Developement of Violationfrequenzy of the 20 Most Violating Diplomats in 1999. Accumulated Violations are Shown Per Week. Frequenzy In- and Decrease is shown as Left and Right Curves. - Sources - Based by Kind Permission on Data from: Ray Fisman and Edward Miguel, [...].](/internal/media/dispatcher/280722/thumbnail)
Plakat
FD-2 - Flocking Diplomats New York - Individual Frequenzy Traces 1999 - The Diagram Shows the Developement of Violationfrequenzy of the 20 Most Violating Diplomats in 1999. Accumulated Violations are Shown Per Week. Frequenzy In- and Decrease is shown as Left and Right Curves. - Sources - Based by Kind Permission on Data from: Ray Fisman and Edward Miguel, [...].
Catalogtree, Arnheim, NL
2008
Plakat
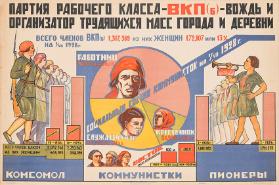
Partija rabočego klassa – VKP(b) – vožd’ i organizator trudjaščichsja mass goroda i derevni
F. K. Lecht
1928
/
1